Always in season
MetService mobile app and website design and development
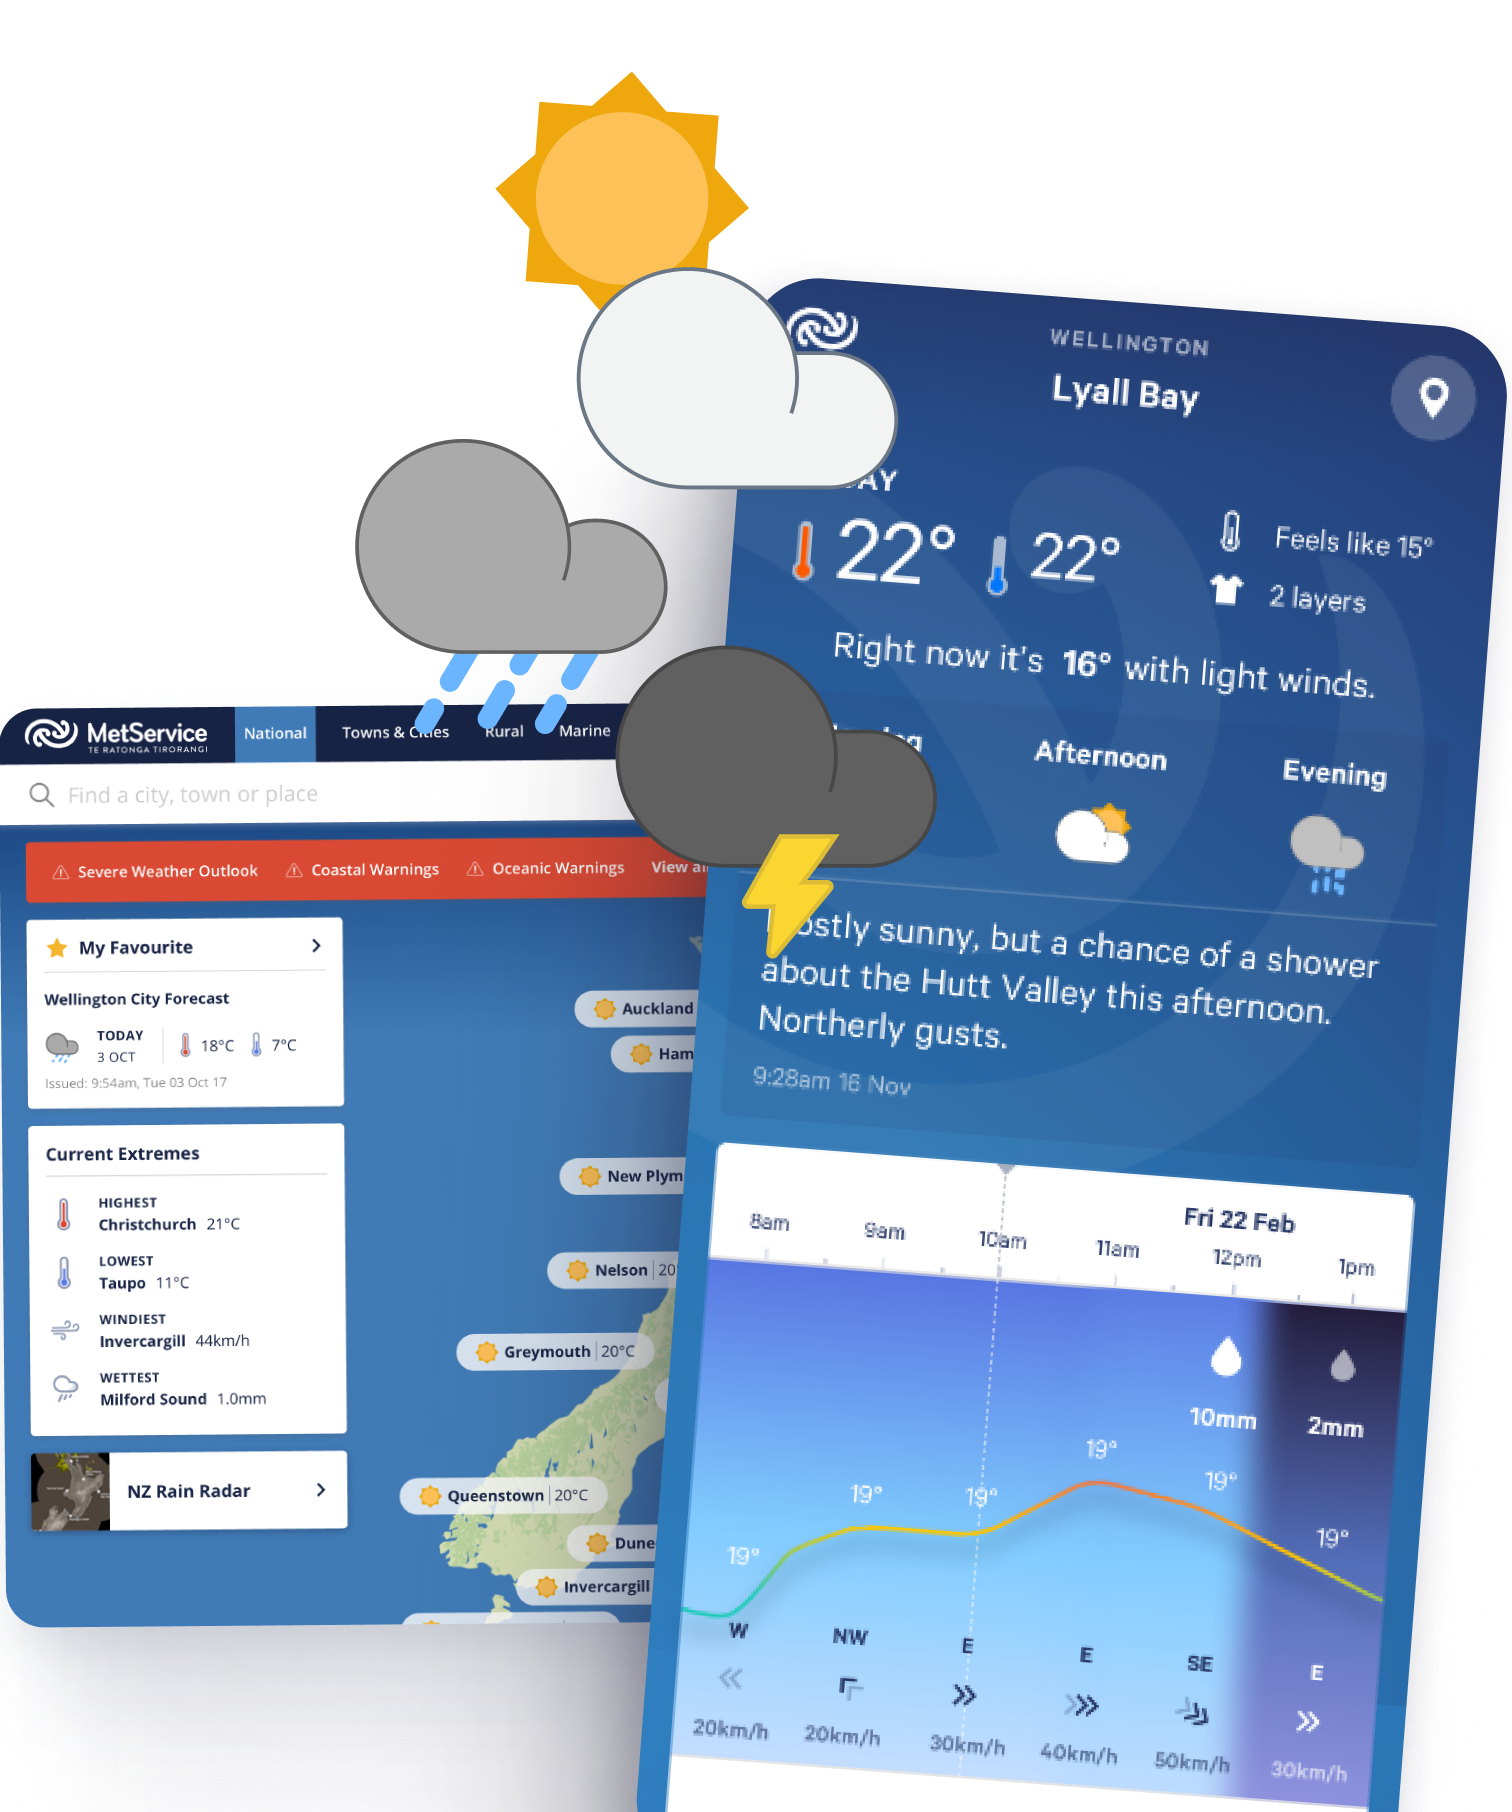
There’s a reason we Kiwis love to talk about the weather - it affects us all, all the time. MetService has the 4th most visited website in Aotearoa, and during a major weather event, over a million of us head there and to the mobile app for vital information!
Beneath the sunny exterior sits a huge amount of complexity - the website relies on 137,000 data points, refreshed continually in real-time, to tell us if we should hang out the washing, take an umbrella, or chuck snow chains on the car.
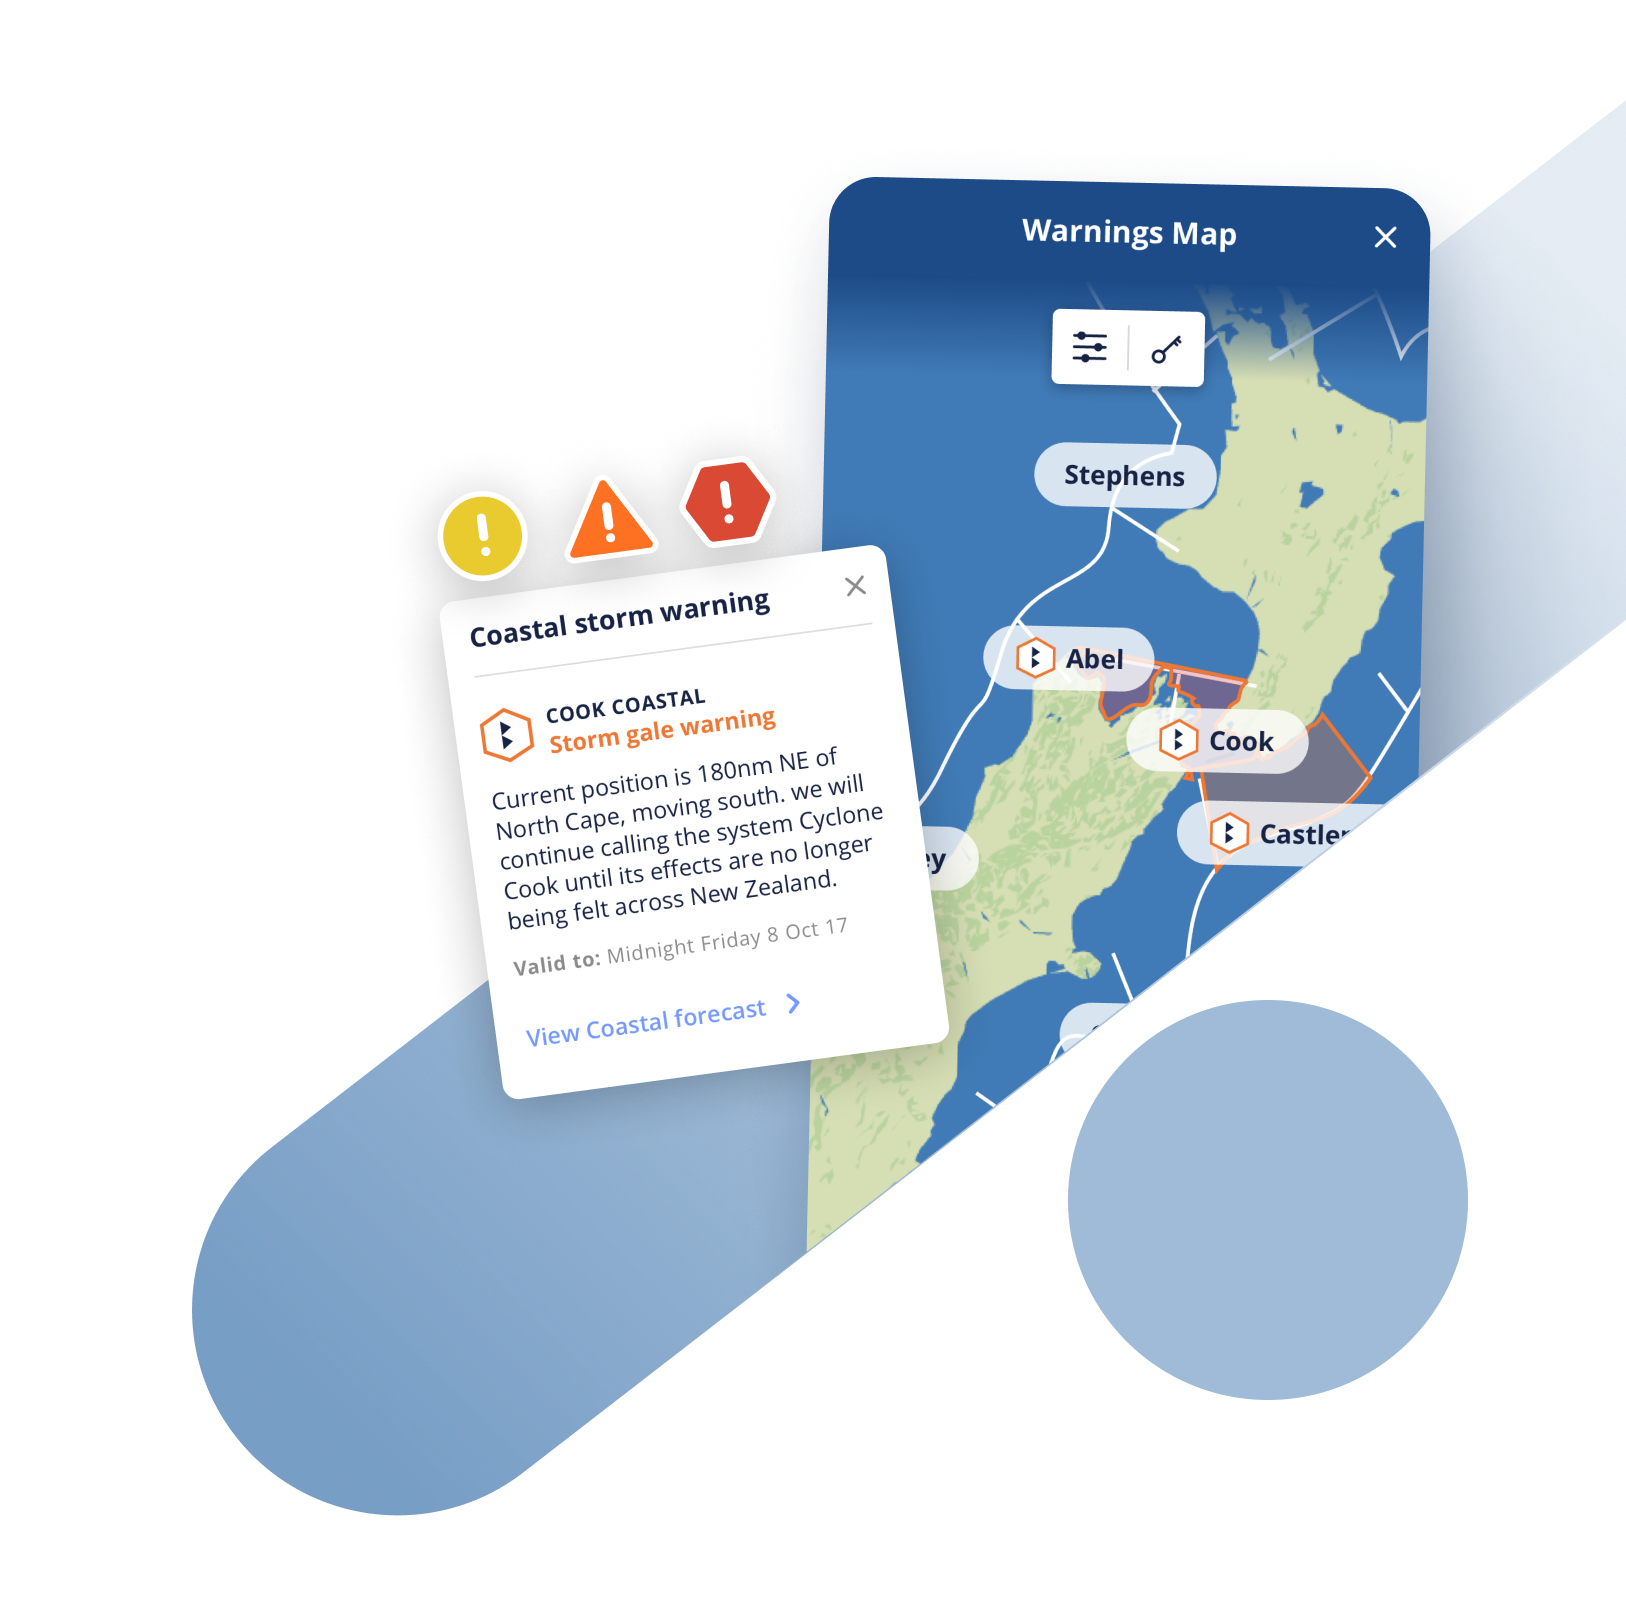
And when there are storms on the way, the hyper-flexible modular design allows MetService to easily surface critical information like Severe Weather Warnings.
Blue sky thinking
MetService has an obligation to keep all Kiwis well-informed about the weather so they can make the right calls and stay safe out there.
The challenge was how to streamline vast amounts of real-time scientific information so that on a daily basis we get the key facts we need (without a deluge of data) but communities who depend on more detail - like farmers or boaties - are well equipped with vital updates.
The approach was for the mobile app to provide ‘snackable’ weather content, while MetService.com would deliver more in-depth information. But both products also needed to support integration with third-party data - from Waka Kotahi (NZ Transport Agency), Department of Conservation, NZ Mountain Safety Council, and more.
This information needed to be conveyed using consistent, easy-to-understand visual language, especially when it come to important weather warnings. On top of these requirements, the solutions needed to support highly flexible ad displays which generate revenue to fund the service.
Test, test, and test again!
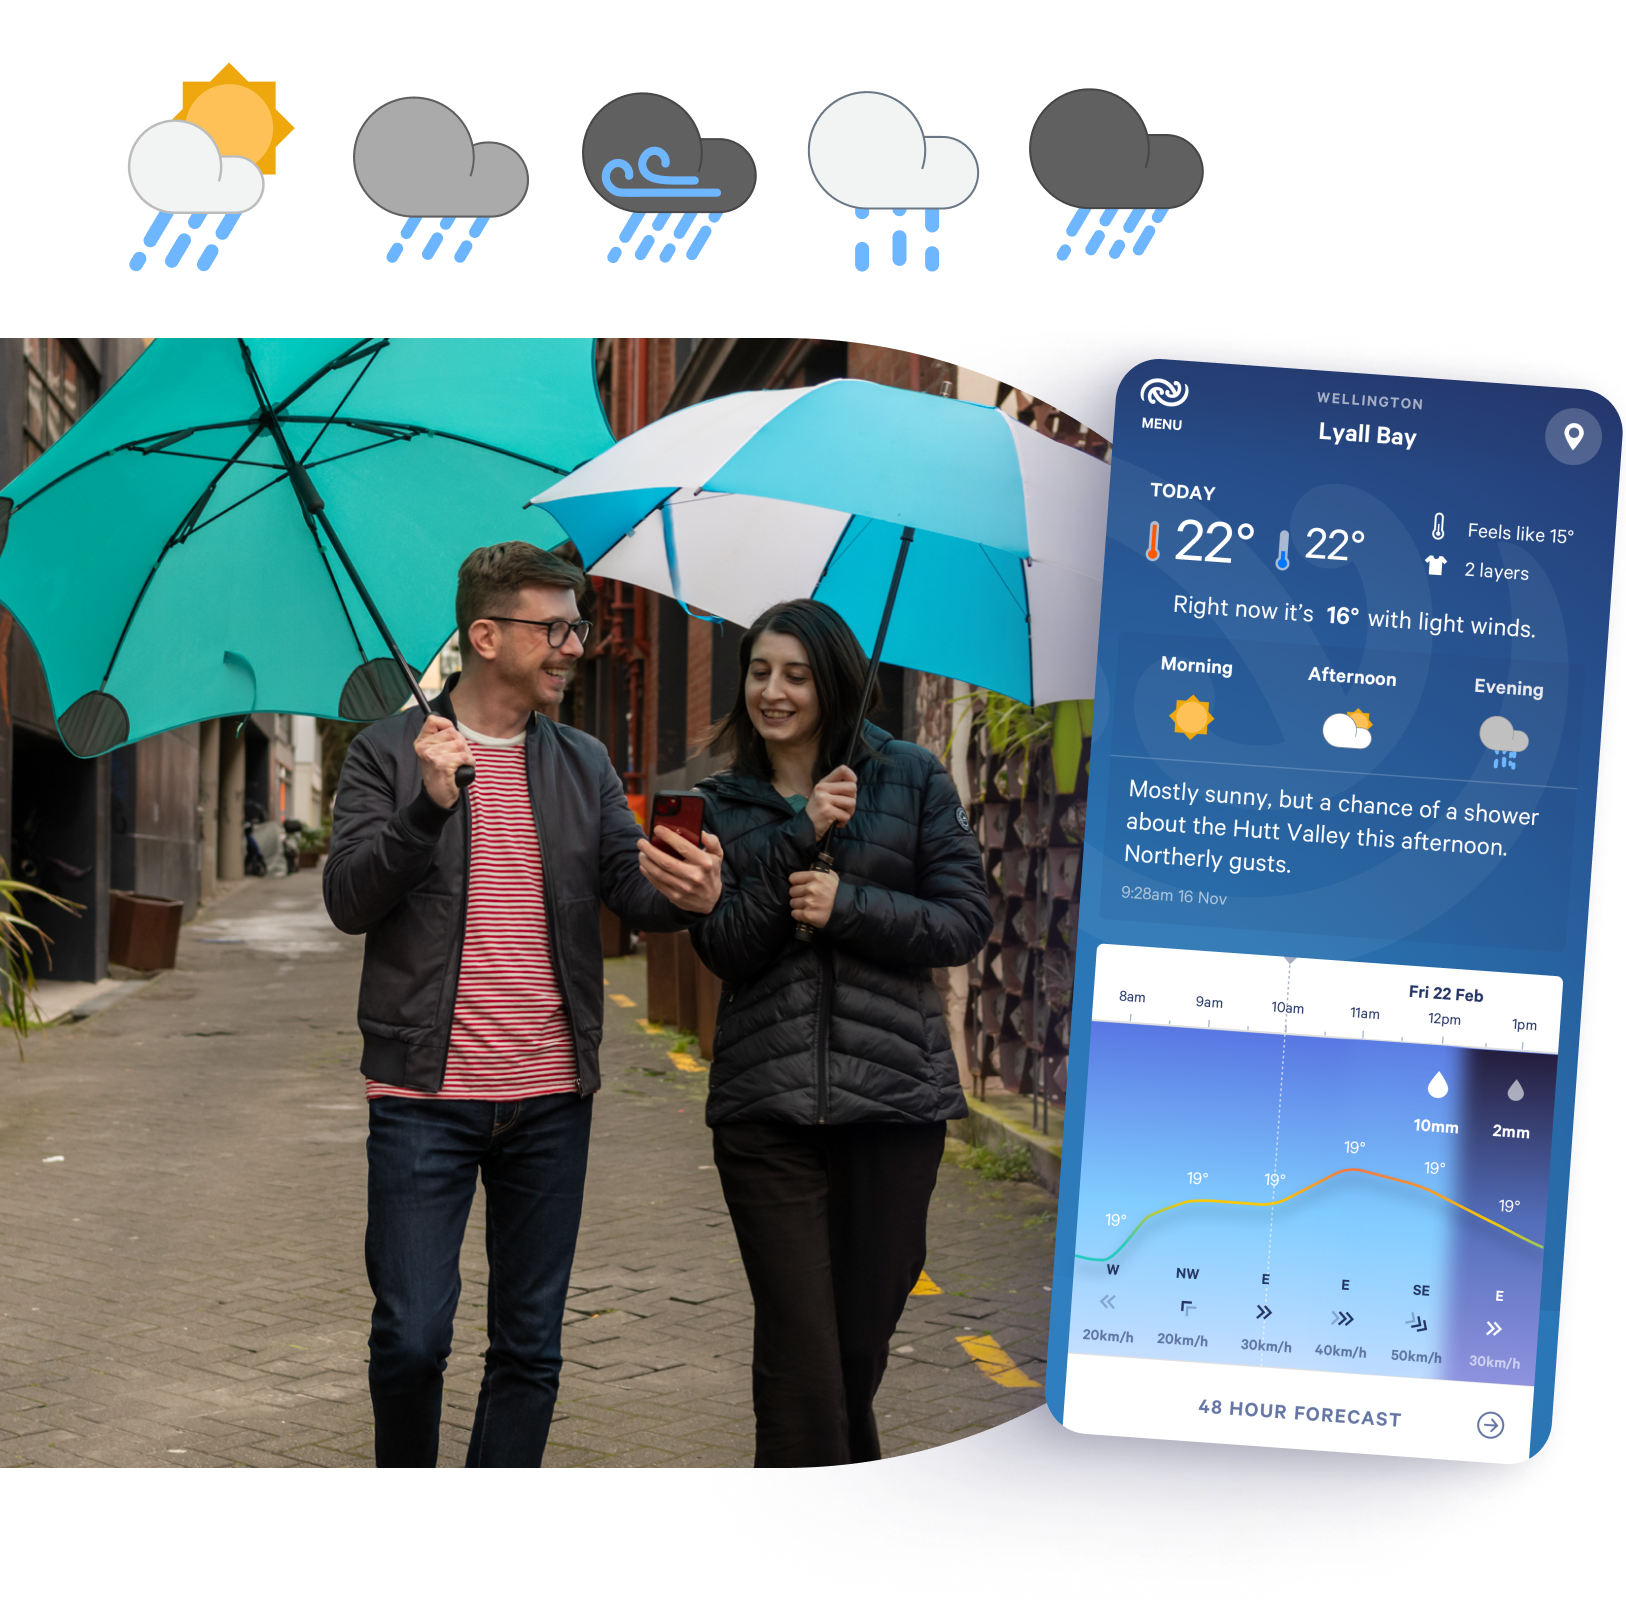
To make sure these products would meet the many and varied needs of this enormous user base, we did lots of research with different target audiences, using a variety of methodologies including heuristic interviews, card sorting, and tools like LookBack for unmoderated usability testing. Individual elements such as rain drop icons were re-tested up to 50 times so we knew exactly how to visualise ‘a lot’ of rain.
More data than rain in July
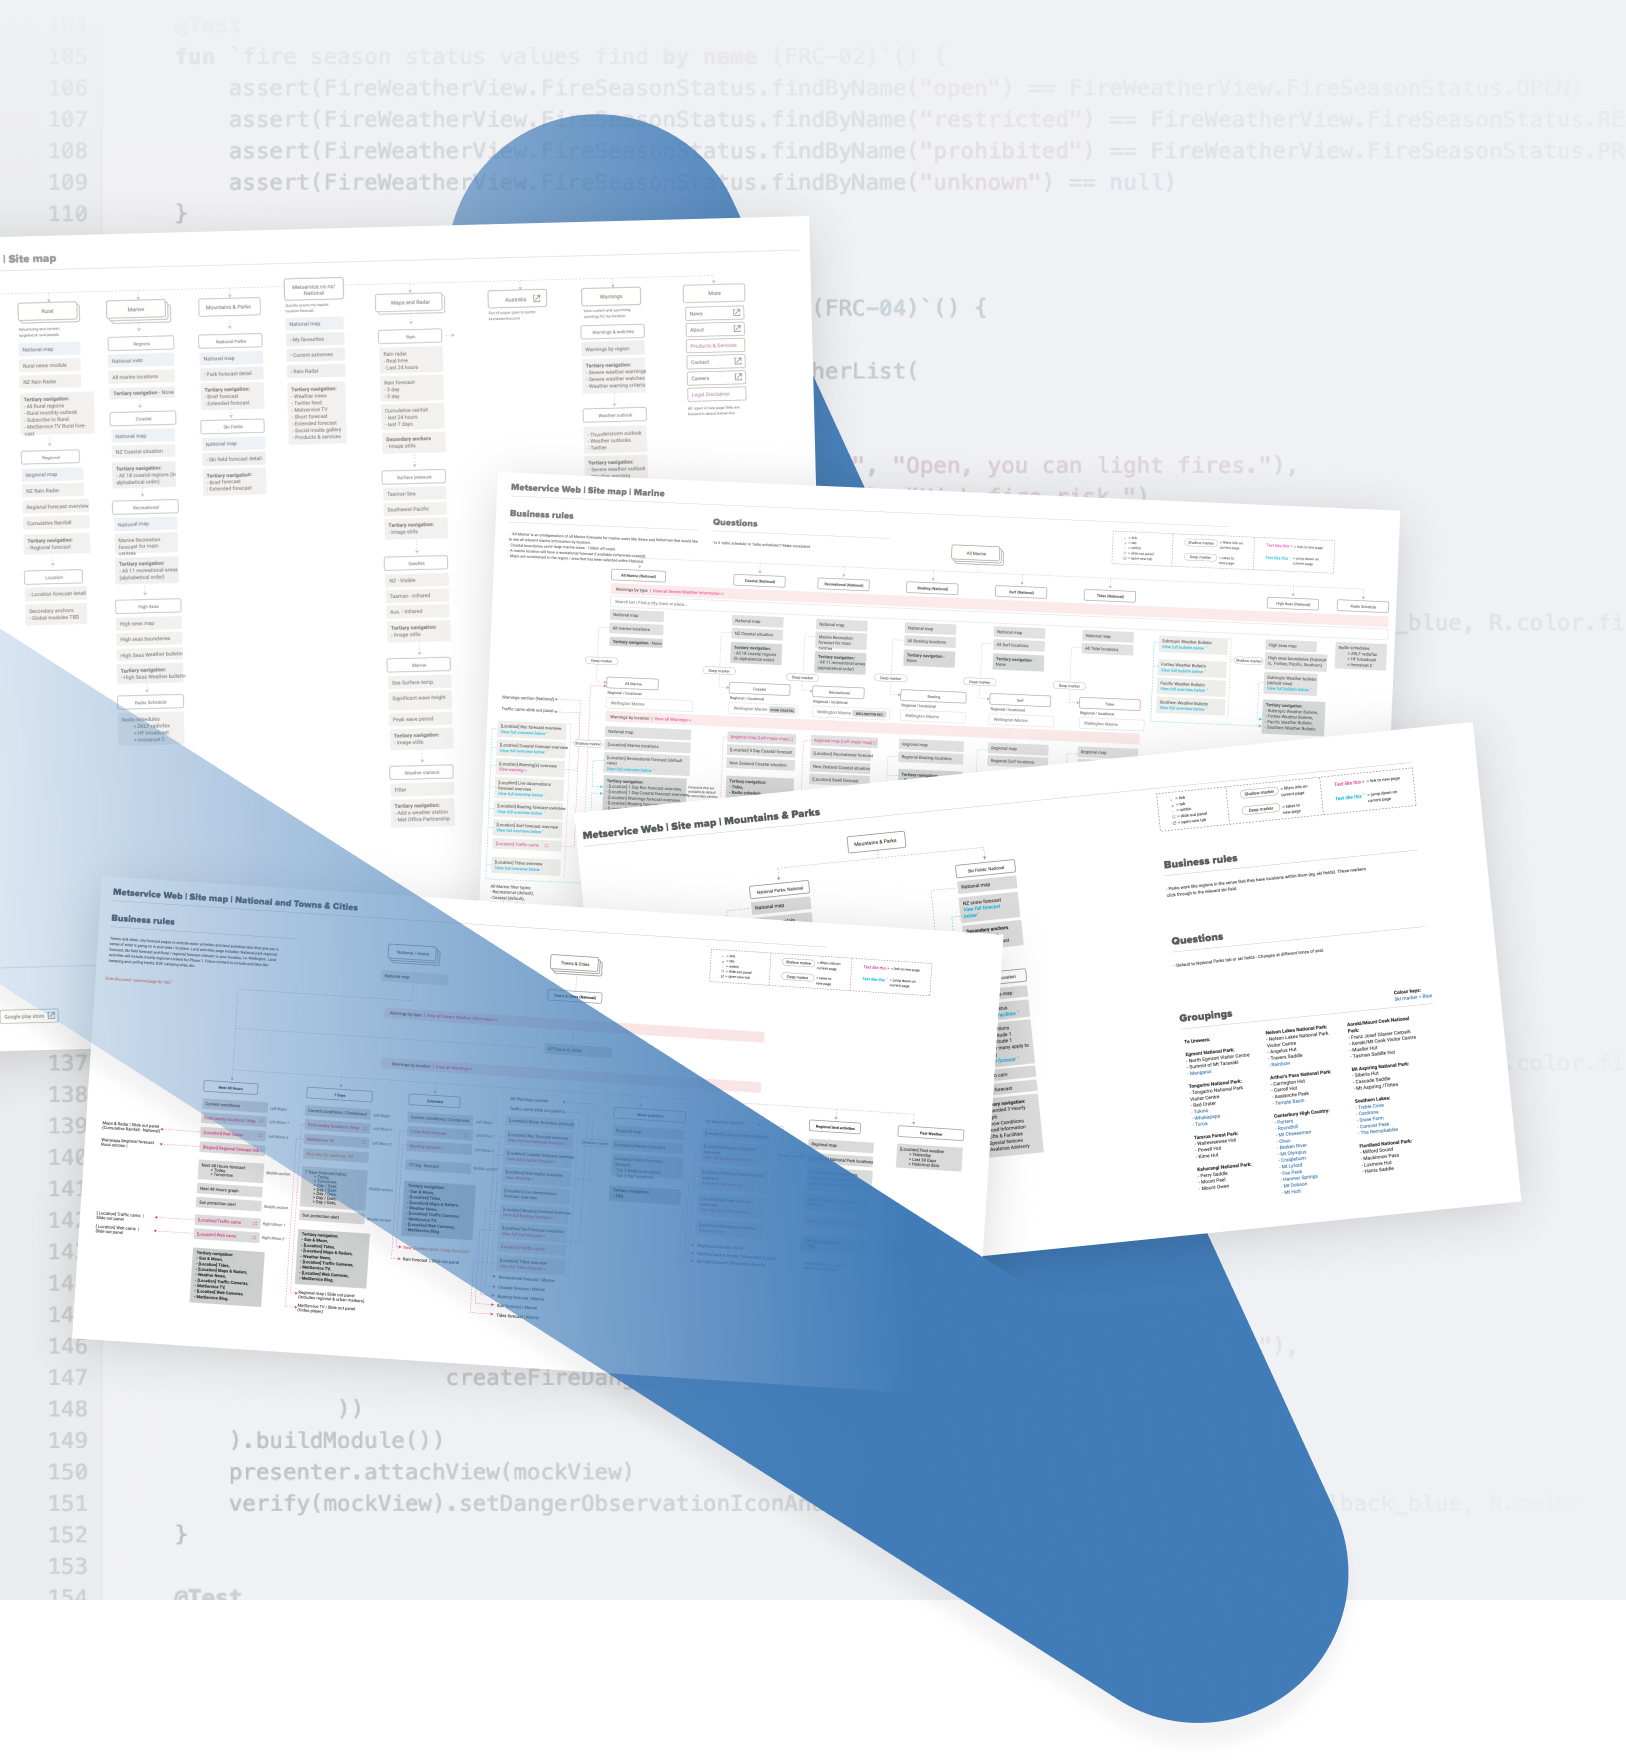
Because weather conditions are constantly changing, MetService wanted the ability for any type of weather component to be displayed anywhere on the website.
To meet this need, we created a modular, fully responsive design with all components, including ads, served dynamically from the API layer. Theoretically, any component can go anywhere, at any breakpoint, which means an infinitely huge number of possibilities to consider.

This made for a mighty complex IA - that could wallpaper a large meeting room (we know because we tried it) - but it gave MetService the power and flexibility to change the products as the conditions change around the country.
Keeping people safe
As Aotearoa’s only official provider of Severe Weather Warnings, enhancing the visibility and accessibility of safety-critical information was paramount so that everyone can be alert and prepared.
Forecasts for all
Highly targeted pages and components were created to deliver information around special interests including marine (coastal, recreational, surf, tides, high seas); national parks (summits, visitor centres, huts, tourist areas, warnings and closures), and ski fields (snow conditions, forecasts, live-cam footage, road information, avalanche advisory, and individual statuses of lifts, skills parks/pipes).
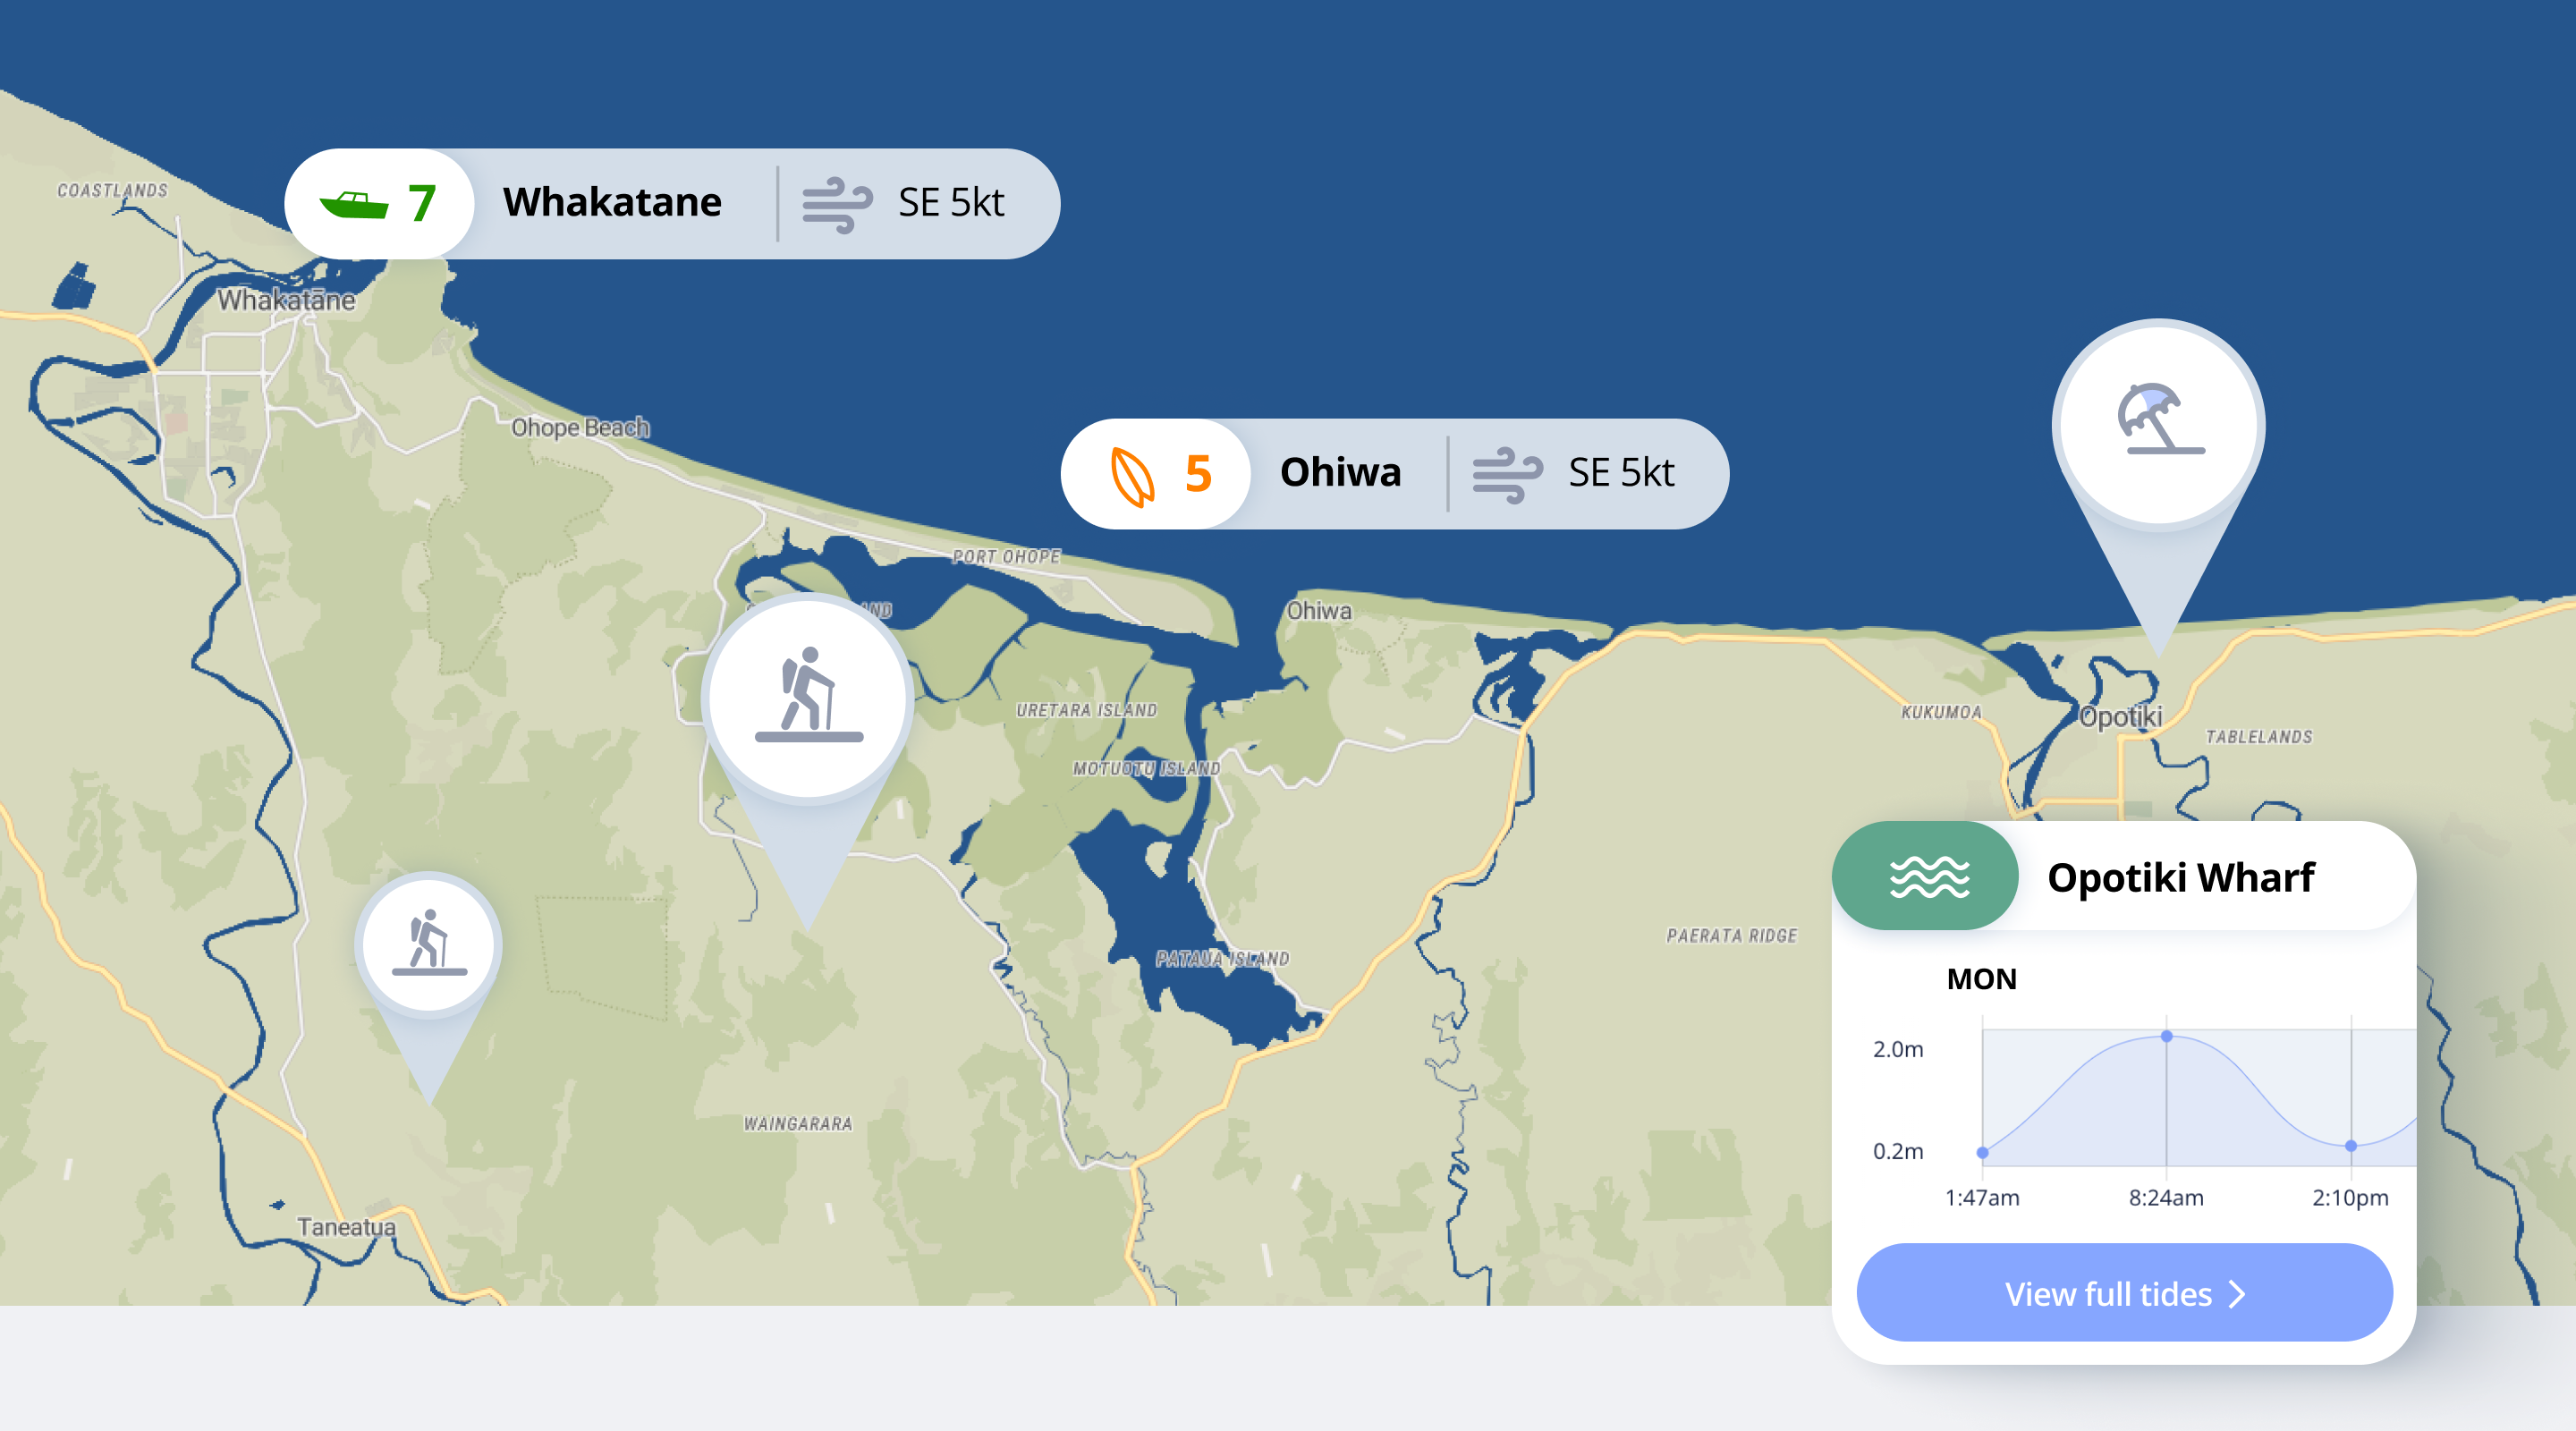
A clear view on what’s happening
To make information quick and easy to consume, we created a range of specialist views, data visualisations and map overlays, featuring:
- Rain radar with real-time map images
- Satellite and weather stations
- Charts and graphs
- Relevant forecast icons and statuses
- Timeline modals
- Webcam videos
- Animations showing things like sea surface temperature, significant wave height, and peak wave periods.
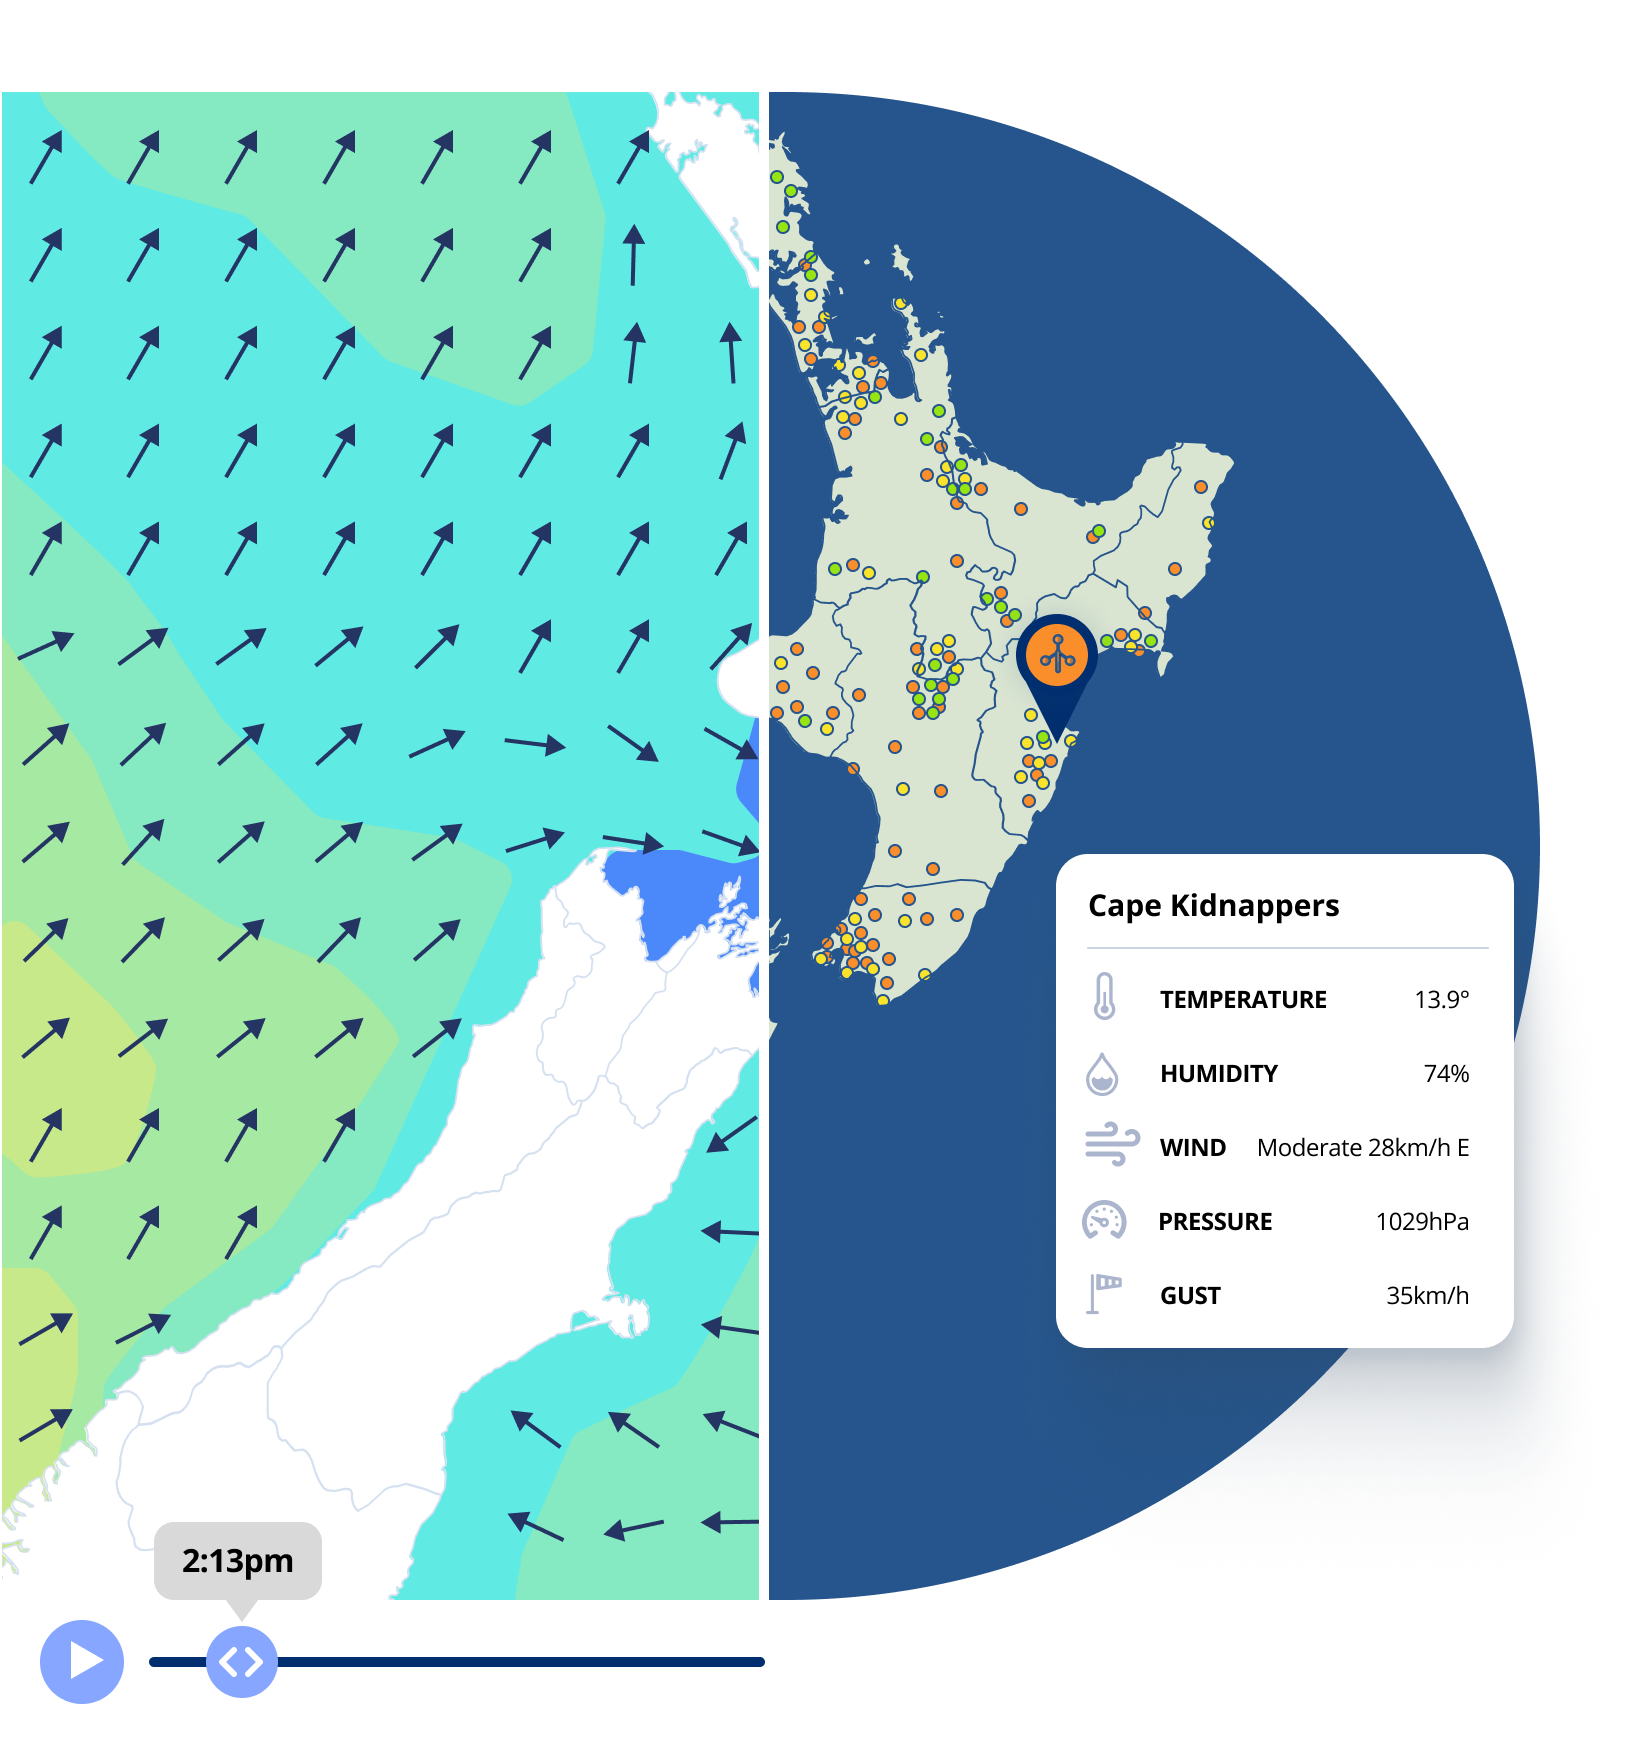
A new way to talk about weather
The new iconography we created for weather indicators is now being used by Civil Defence, Waka Kotahi and TV broadcasters to provide a common visual language for warnings and weather throughout Aotearoa.
Can I just say that I love the new website? Most of all because almost all of the information now reads properly with (and makes sense to) screen reading software for the blind. #A11y
Twitter user
Clear skies ahead
Working together we have helped to transform MetService’s approach to digital delivery and created a better outcome for all of Aotearoa. Their data is now so consistent and easy to consume that not only do millions of Kiwis depend on them but many other relevant parties pull their information from MetSerivce too.
By building in the ability to host ads, MetService has been able to generate critical revenue that supports them to provide the right information at the right time to the people who need it - come rain, hail or shine.